
Built by Logan / Case study / Business intelligence
Industry Benchma Benchmarking
What is normal for a plumbing contractor in Dallas County, or a full-service restaurant in Nashville? The engine answers that for 821 industries in 3,100 counties, from 13.7 million federal records, with every figure labeled by its source and its real geographic grain.
- DBusiness intelligence
- BHard-to-get data, made usable
- CSoftware you own
- $100k $150kto
- what a dedicated development team would charge to build it
- $15,000
- what Logan would charge to build it for you
- About$80
- in software and AI usage to build it internally (your team's time excluded)
- 13weeks
- from the written spec to a working seven-mode console, built alongside other projects
Team figure is the founder's estimate of what a dedicated team would charge, not a quote. Internal figure is reconstructed from usage records. 6 active build days, 37 commits.
What problem does it solve
The data exists. It has never been in one place.
Nine federal statistical programs describe every industry in America, each with its own codes, geographies, vintages, and suppression rules. Reconciling them by hand for one question takes an analyst a day, so most business decisions, loans, and acquisitions get made against gut feel or a national average that means nothing locally.
What impact does it have
288,092 profiles. Zero guesswork.
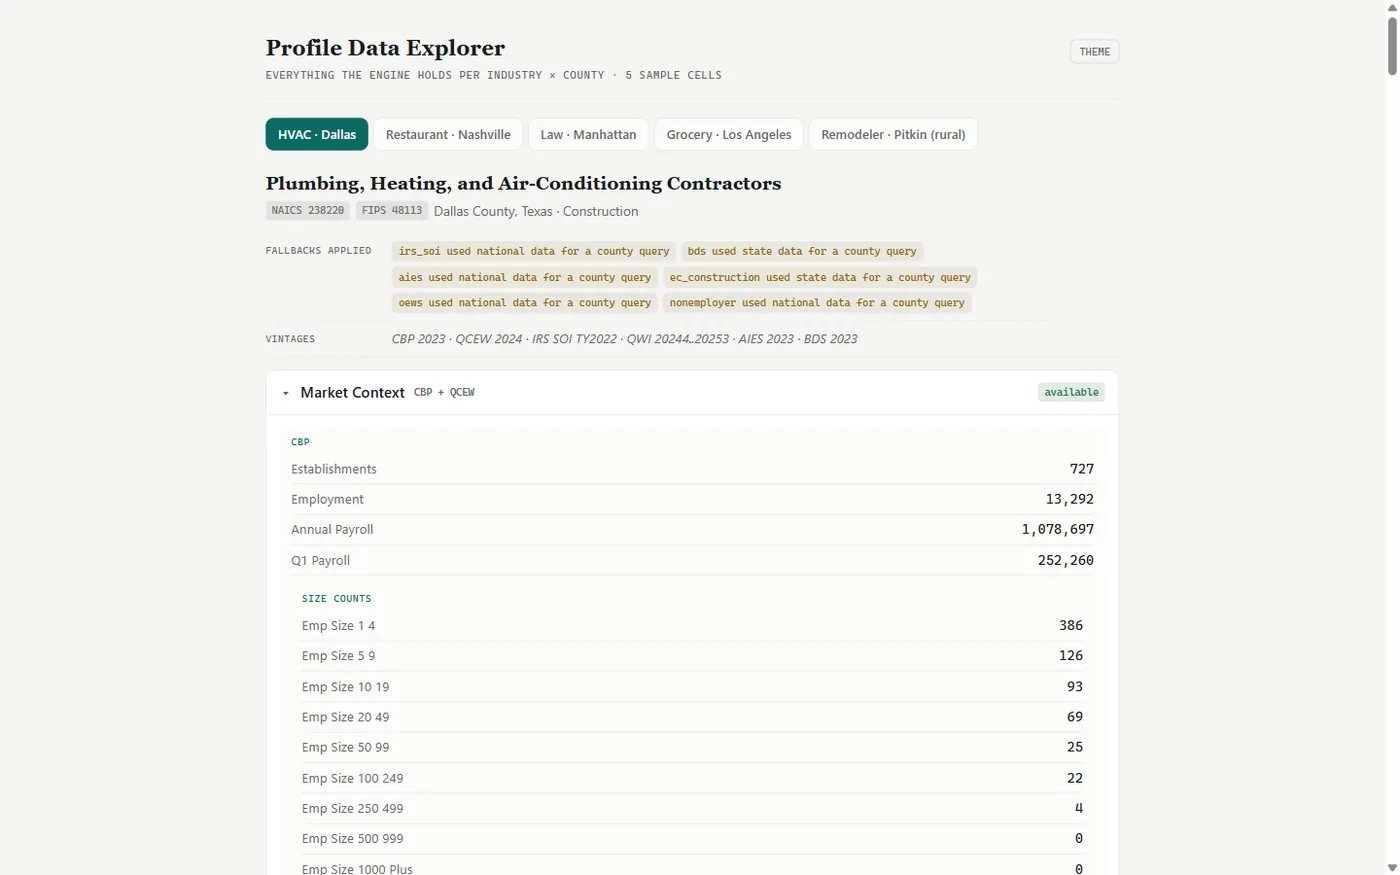
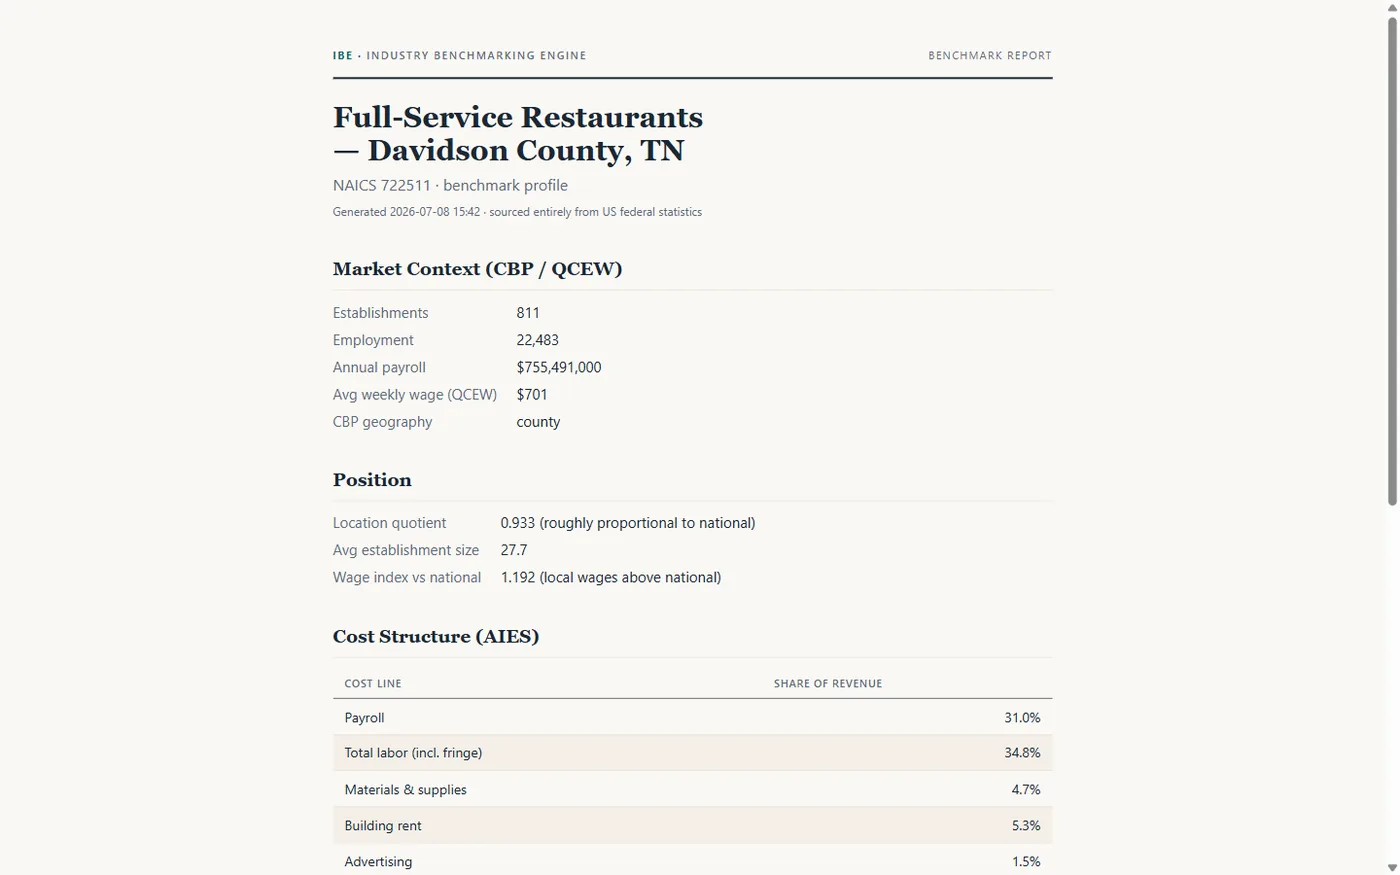
Every eligible industry-by-county cell gets a deterministic profile: establishments, employment, wages, payroll, growth, cost structure where the data allows, and a plain statement of what is missing. Dallas County plumbing: 727 establishments and 13,292 employees. Davidson County restaurants: 811 establishments, 22,483 employees, $701 average weekly wage. Ask for any of the 288,092 and it is already rendered.
What value does it have
One data asset, many products.
The same foundation serves benchmarking, screening whole markets by a metric, business-versus-peer comparison, credit-memo context, acquisition normalization, and grounded question-answering. Numbers come from a deterministic renderer, never from a language model, so every figure can be checked. It is owned infrastructure that any advisory, lending, or diagnostic product can sit on top of.
What it does today
A working data engine and console. Everything below runs locally today.
Data foundation
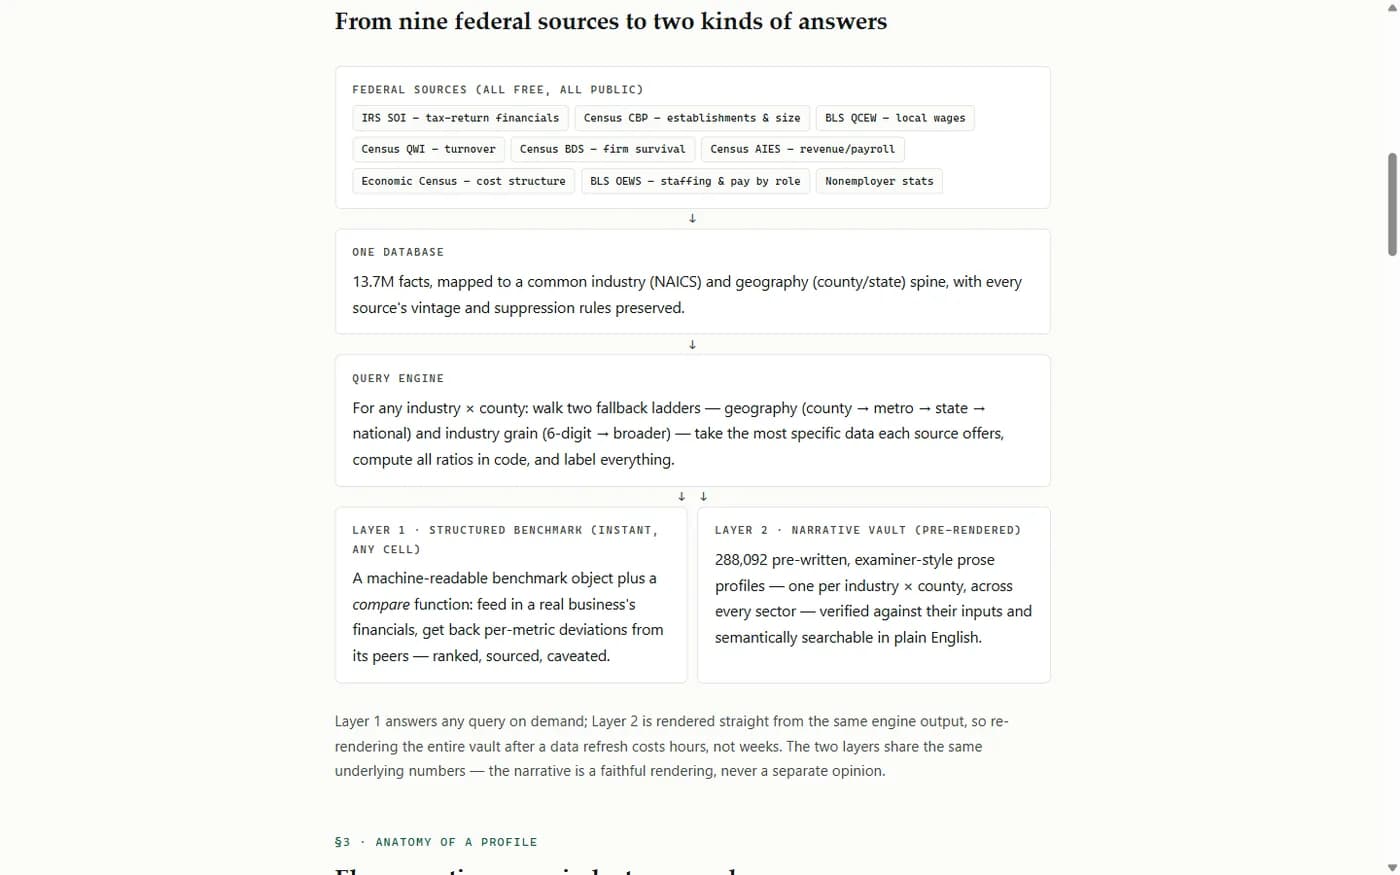
- Nine federal source families consolidated into one PostgreSQL warehouse
- 13.7 million records mapped to a common industry and geography spine
- Explicit industry and geographic fallback ladders, disclosed on every output
- Suppression, vintage, and grain carried with every figure
- Regression gate that checks every numeric claim against its source input
Profiles and benchmarks
- 288,092 deterministic industry-by-county profiles across 19 sectors
- Establishments, employment, wages, payroll, business dynamics, and cost structure
- Detailed cost lines for construction and thirteen more sectors where federal data exists
- Location quotient and small-operator share for market-gap analysis
Console modes
- Benchmark: the full sourced profile for one industry and county
- Screen: rank the whole eligible grid by any metric, with scope and minimum-size controls
- Compare: position a business's financials against its public peer benchmark
- Credit Memo: the grounded industry and market section, with deviations flagged as questions
- Normalize: a cited SDE-to-EBITDA bridge with owner-compensation and rent anchors
- Ask and Search: retrieval over the source-linked records with query-time narration
- Export to HTML, CSV, and Markdown, print-ready
On the roadmap
- Hardened multi-user product with identity and audit
- Query-constrained Ask and Search for external use
- Refresh automation as new federal vintages land
Why owning it matters
The asset is the data model, not the dashboard.
Anyone can buy a chart. Nine reconciled federal sources with honest fallback rules is the part nobody sells, and it is owned outright.
Every product gets it for free.
Bottleneck diagnostics, acquisition diligence, lending prep, and market selection all read the same warehouse. No per-seat, per-query, or per-report fees, ever.
Deterministic means defensible.
When a banker or a buyer asks where a number came from, the answer is a source, a vintage, and a calculation. Not a model's best guess.
Why the operator built it
Why the person asking the question built the engine.
The hard part is knowing what 'normal' should mean.
Nine federal programs disagree about geography, vintage, and what counts as an establishment. Deciding which source wins for a plumber in Dallas, and when to fall back to the state, is an advisory judgment, not a data-engineering one. The operator who would use the answer made those calls directly, in code, instead of explaining them to a team that would have to guess.
Deterministic on purpose.
An outside team in 2026 would have shipped a chat box over the data. The operator wanted every number to trace to a source and a calculation, because bankers and buyers ask where figures come from. That decision, made by the person who would be asked, shaped the whole build.
Thirteen weeks of thinking, six days of building.
The spec was written in April. When the engineering started in July, alongside other projects, the warehouse, the profile renderer, and the console came together in six build days. The time went into deciding what to build, not into waiting on a vendor to build it.
That is what the Vista AI Cohort teaches: operators building their own software, with a community for the parts that need a second set of eyes.
See it
Real outputs from the engine. Public aggregate data only; nothing to blur.
 Next project · In productionFoothill Intelligence LoopAd intelligence, permit targeting, and a media review console that tell a roofing company where the next job is.
Build your own advantage.
Get a personal AI trainer and a community for the parts that need a second set of eyes.